Prometheus is used an open source software, that can collect metrics and alerting.
You can download latest version oof Prometheus from
https://prometheus.io/download/
Create a user
useradd --no-create-home --system --shell /bin/false prometheus
Download and Install prometheus
cd /usr/local/src
wget https://github.com/prometheus/prometheus/releases/download/v2.31.0-rc.1/prometheus-2.31.0-rc.1.linux-amd64.tar.gz
tar xvf prometheus-2.31.0-rc.1.linux-amd64.tar.gz
cd prometheus-2.31.0-rc.1.linux-amd64
mv prometheus /usr/local/bin/
mv promtool /usr/local/bin/
mkdir /etc/prometheus
mkdir /var/lib/prometheus
mv consoles /etc/prometheus
mv console_libraries /etc/prometheus
mv prometheus.yml /etc/prometheus
chown prometheus:prometheus /etc/prometheus
chown prometheus:prometheus /var/lib/prometheus
Create a service file
vi /etc/systemd/system/prometheus.service
Add following content
[Unit]
Description=Prometheus
Wants=network-online.target
After=network-online.target

[Service]
User=prometheus
Group=prometheus
Type=simple
ExecStart=/usr/local/bin/prometheus \
    --config.file /etc/prometheus/prometheus.yml \
    --storage.tsdb.path /var/lib/prometheus/ \
    --web.console.templates=/etc/prometheus/consoles \
    --web.console.libraries=/etc/prometheus/console_libraries

[Install]
WantedBy=multi-user.target
Enable prometheus to start on boot
systemctl enable prometheus
Start prometheus
systemctl start prometheus
systemctl status prometheus
Prometheus runs on port 9090, you can access promethus at
http://YOUR_SERVER_IP:9090/graph
It will look like
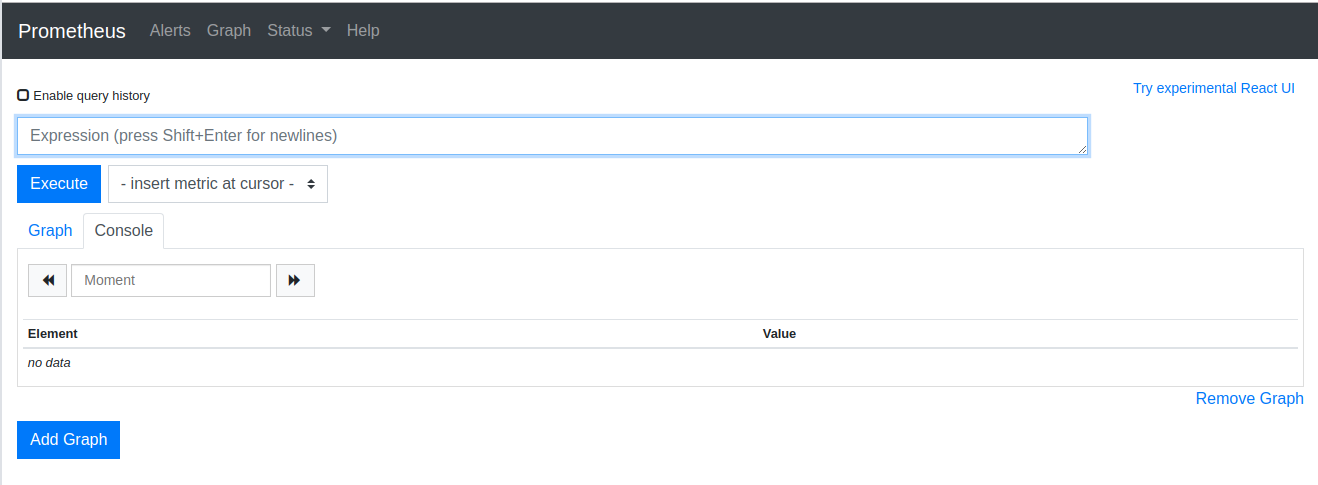
Prometheus have some basic graphing features, but you can’t use it for monitoring. To create dash board and monitor, you need to use grafana.
Collecting Data
Node Exporter is used to collect data from servers. All monitored servers need Node Exporter installed. You can download latest version of NodeExporter from
https://github.com/prometheus/node_exporter/releases
Lets create a user for Node Exporter to run
useradd --no-create-home --system --shell /bin/false node_exporter
Install Node Exporter
cd /usr/local/src
wget https://github.com/prometheus/node_exporter/releases/download/v1.2.2/node_exporter-1.2.2.linux-amd64.tar.gz
tar xvf node_exporter-1.2.2.linux-amd64.tar.gz
cd /usr/local/src/node_exporter-1.2.2.linux-amd64/
mv node_exporter /usr/local/bin/
Create a systemd service file for node exporter
vi /etc/systemd/system/node_exporter.service
Add
[Unit]
Description=Node Exporter
Wants=network-online.target
After=network-online.target

[Service]
User=node_exporter
Group=node_exporter
Type=simple
ExecStart=/usr/local/bin/node_exporter

[Install]
WantedBy=multi-user.target
Enable and start Node Exporter
systemctl enable node_exporter
systemctl start node_exporter
systemctl status node_exporter
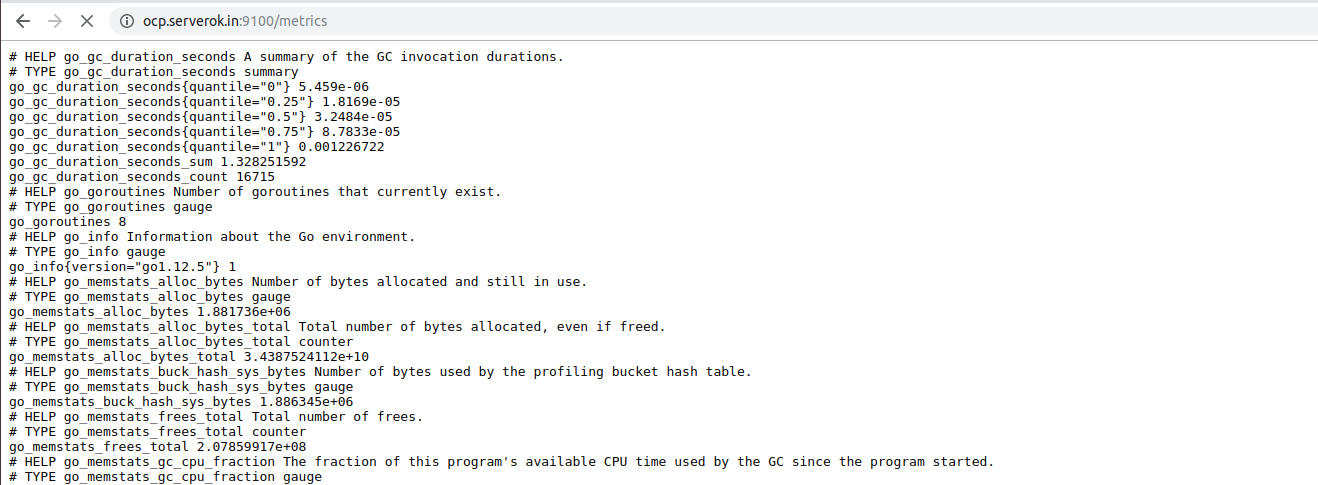
Node Exporter run on port 9100 and expose system metrics on url
http://SERVER_IP:9100/metrics
Adding Servers to Prometheus
Once Node Exporter installed on a server, you need to tell Prometheus to get data from the Node Exporter you just installed. To do this, edit Prometheus configuration file.
vi /etc/prometheus/prometheus.yml
Add following
  - job_name: 'node_exporter'
    scrape_interval: 5s
    static_configs:
      - targets: ['SERVER_IP:9100']
To monitor multiple servers, you can dd more servers in targets line. Here is an example config
https://gist.github.com/serverok/83a622e7577da36384f87fe60c9930af/raw
Restart prometheus
systemctl restart prometheus
Grafana
Grafana is used to visualise data collected by Prometheus. You can download Grafana from
https://grafana.com/grafana/download
Grafana offers free cloud hosted version with some limitation (1 user, 5 dashboards). Free version is suitable if you are getting started and don’t want to install your own. You can signup for cloud hosted version at
If you decide to install your own Grafana, you can run
cd /usr/local/src
wget https://dl.grafana.com/oss/release/grafana_7.3.7_amd64.deb
dpkg -i grafana_7.3.7_amd64.deb
Enable and start grafana
systemctl enable grafana-server
systemctl start grafana-server
systemctl status grafana-server
If you did your own install, grafana runs on port 3000. To access, use url
http://SERVER_IP:3000/login
Default username and passwords are “admin”. Once logged in you will be asked to set password for grafana admin user.
Before you can use Grafana, you need to set a data source and create dash board. In our case, data source is prometheus. To connect Grafana to your Prometheus insallation, go to Settings > Data Sources
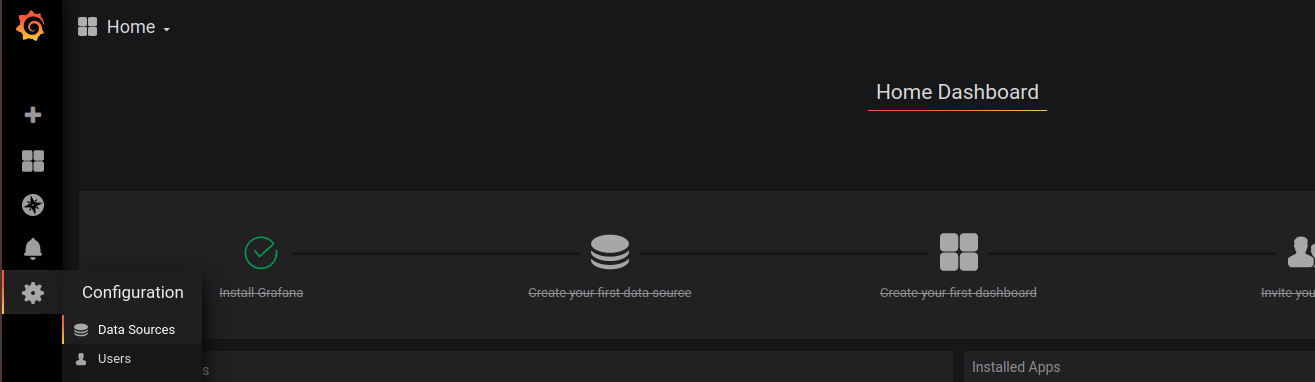
On next page, select Prometheus
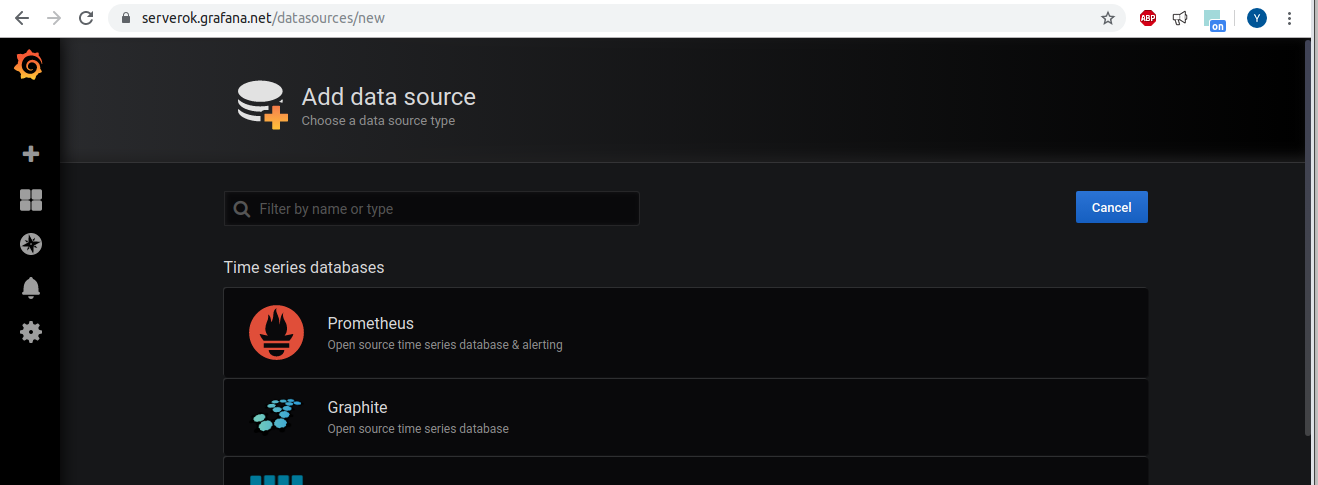
On next page, for URL, enter http://PROMETHUS_SERVER_IP:9090, scroll down, click on “Save & Test” button. If grafana can connect to your prometheus installation, you should see success message with “Data source is working”. If not, you need to check your firewall rules.
Creating Grafana Dashboards
Grafana displays data in dash boards. You can create your own or use pre existing dash boards. You can find pre-made dash boards at
https://grafana.com/grafana/dashboards
On my grafana installation, i used dashboard
https://grafana.com/grafana/dashboards/11074
To add this dash board to your Grafana, click on the + button, then select Import. On next screen, you can enter ID for the dash board you need to import. In this case 11074. Click “Load” button to import the dash board.
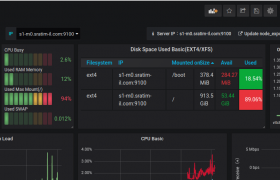
Here is a dash board for one of the server
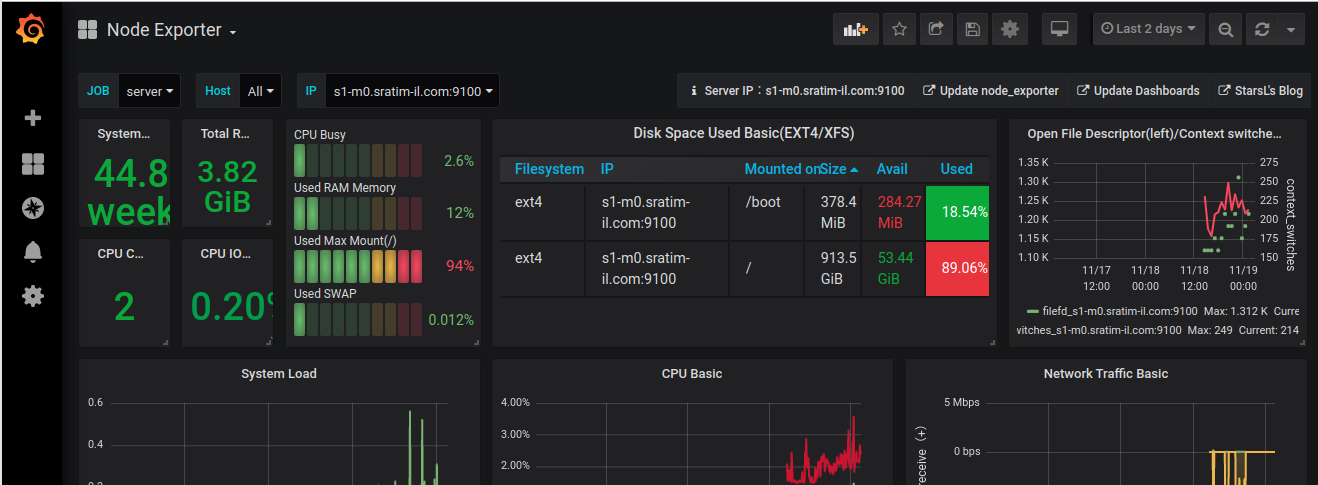
You can edit Panels in grafana dash board to see how it is created. You can create a new dash board with panel you need. This way your dashboards only show required information.
Related Posts
Prometheus Node Exporter on non default port
Prometheus init script for CentOS 6