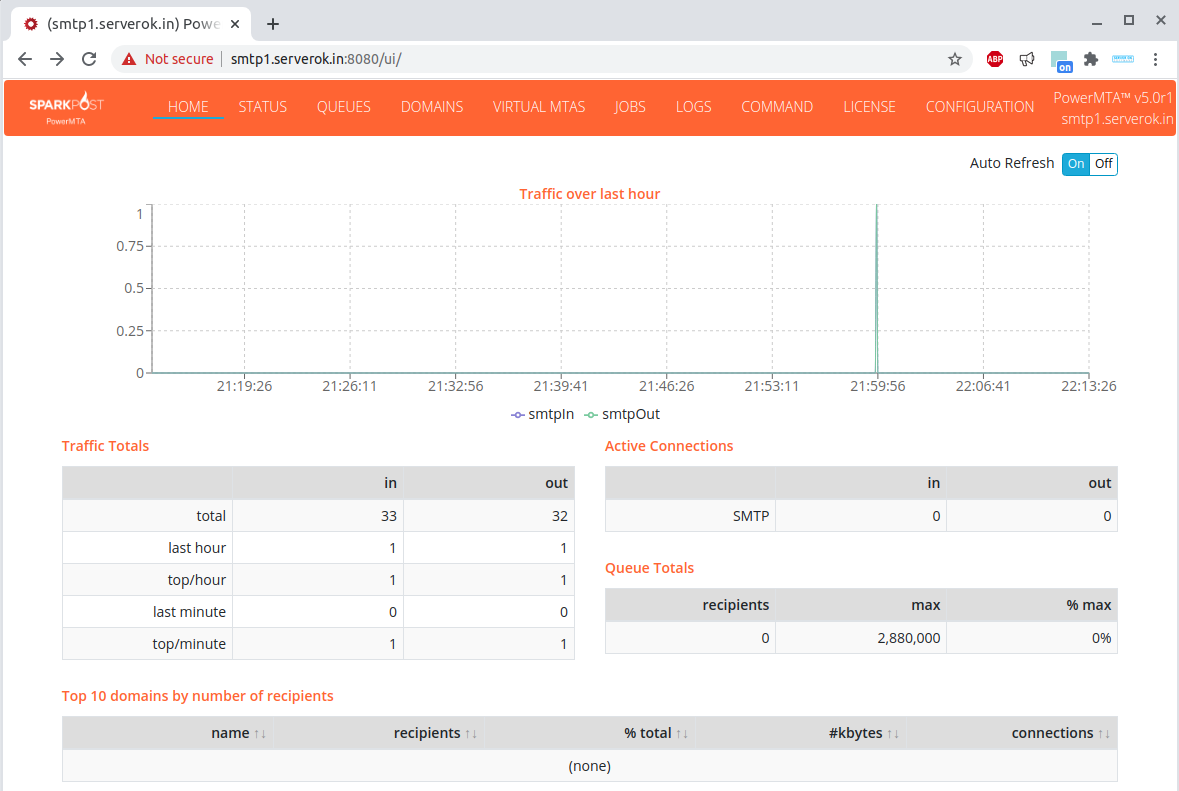
PowerMTA comes with a Web Monitor UI, that will show you some stats about your mail server, also able to run some commands, edit PowerMTA configuration file.
To enable Web Monitor UI, you need to white list your IP address in PowerMTA configuration, for this you need a fixed IP Address.
vi /etc/pmta/config
Find
http-access 127.0.0.1 monitor
http-access ::1 monitor
Add below
http-access 51.38.246.115 admin
Replace 51.38.246.115 with your IP address in above line and restart PowerMTA.
systemctl restart pmta
Now you will be able to access PowerMTA Web Monitor UI at
https://YOUR_MAIL_SERVER_IP:8080/
Web Monitor log file
tail -f /var/log/pmta/pmtahttp.log
See PowerMTA
Leave a Reply