To regenerate grub config on CentOS 7, run
grub2-mkconfig -o /boot/grub2/grub.cfg
If you use UEFI, run
grub2-mkconfig -o /boot/efi/EFI/centos/grub.cfg
OVH CentOS 7 server grub rescue prompt
Back to grub

To regenerate grub config on CentOS 7, run
grub2-mkconfig -o /boot/grub2/grub.cfg
If you use UEFI, run
grub2-mkconfig -o /boot/efi/EFI/centos/grub.cfg
OVH CentOS 7 server grub rescue prompt
Back to grub

To reinstall a package with yum, run
yum reinstall PKG_NAME
Example
yum reinstall kernel
You can restart services on xampp linux using
/opt/lampp/lampp
To restart, use
/opt/lampp/lampp restart
Here are other available options
root@ip-172-31-36-153:~# /opt/lampp/lampp --help Usage: lamppstart Start XAMPP (Apache, MySQL and eventually others) startapache Start only Apache startmysql Start only MySQL startftp Start only ProFTPD stop Stop XAMPP (Apache, MySQL and eventually others) stopapache Stop only Apache stopmysql Stop only MySQL stopftp Stop only ProFTPD reload Reload XAMPP (Apache, MySQL and eventually others) reloadapache Reload only Apache reloadmysql Reload only MySQL reloadftp Reload only ProFTPD restart Stop and start XAMPP security Check XAMPP's security enablessl Enable SSL support for Apache disablessl Disable SSL support for Apache backup Make backup file of your XAMPP config, log and data files oci8 Enable the oci8 extenssion panel Starts graphical XAMPP control panel root@ip-172-31-36-153:~#
To remove SSH private key passphrase, run
ssh-keygen -p -f SSH_PRIVATE_KEY_FILE
Example

Method 2
You can use OpenSSL to remove passphase with
openssl rsa -in PRIVATE_KEY_WITH_PW.key -out PRIVATE_KEY_NO_PW.key
See SSH
To always force webmail to use HTTP on VeataCP, edit file
vi /etc/roundcube/defaults.inc.php
Find
$rcmail_config['force_https'] = false;
Replace with
$rcmail_config['force_https'] = true;
To run Prometheus Node Exporter on custom port, use
/usr/local/bin/node_exporter --web.listen-address=:9101
Here is systemctl service script i used
[root@cdn 1945]# cat /etc/systemd/system/node_exporter.service
[Unit]
Description=Node Exporter
Wants=network-online.target
After=network-online.target

[Service]
User=node_exporter
Group=node_exporter
Type=simple
ExecStart=/usr/local/bin/node_exporter --web.listen-address=:9101

[Install]
WantedBy=multi-user.target
[root@cdn 1945]#
Related Posts

To install Nginx web server on CentOS 8, create repo
vi /etc/yum.repos.d/nginx.repo
Add
[nginx]
name=nginx repo
baseurl=http://nginx.org/packages/centos/$releasever/$basearch/
gpgcheck=0
enabled=1
Install nginx with dnf or yum
dnf install nginx
Open HTTP and HTTPS ports on firewall
firewall-cmd --zone=public --permanent --add-service=http
firewall-cmd --zone=public --permanent --add-service=https
firewall-cmd --zone=public --permanent --add-service=ssh
firewall-cmd --reload
Prometheus is used an open source software, that can collect metrics and alerting.
You can download latest version oof Prometheus from
https://prometheus.io/download/
Create a user
useradd --no-create-home --system --shell /bin/false prometheus
Download and Install prometheus
cd /usr/local/src
wget https://github.com/prometheus/prometheus/releases/download/v2.31.0-rc.1/prometheus-2.31.0-rc.1.linux-amd64.tar.gz
tar xvf prometheus-2.31.0-rc.1.linux-amd64.tar.gz
cd prometheus-2.31.0-rc.1.linux-amd64
mv prometheus /usr/local/bin/
mv promtool /usr/local/bin/
mkdir /etc/prometheus
mkdir /var/lib/prometheus
mv consoles /etc/prometheus
mv console_libraries /etc/prometheus
mv prometheus.yml /etc/prometheus
chown prometheus:prometheus /etc/prometheus
chown prometheus:prometheus /var/lib/prometheus
Create a service file
vi /etc/systemd/system/prometheus.service
Add following content
[Unit]
Description=Prometheus
Wants=network-online.target
After=network-online.target

[Service]
User=prometheus
Group=prometheus
Type=simple
ExecStart=/usr/local/bin/prometheus \
    --config.file /etc/prometheus/prometheus.yml \
    --storage.tsdb.path /var/lib/prometheus/ \
    --web.console.templates=/etc/prometheus/consoles \
    --web.console.libraries=/etc/prometheus/console_libraries

[Install]
WantedBy=multi-user.target
Enable prometheus to start on boot
systemctl enable prometheus
Start prometheus
systemctl start prometheus
systemctl status prometheus
Prometheus runs on port 9090, you can access promethus at
http://YOUR_SERVER_IP:9090/graph
It will look like
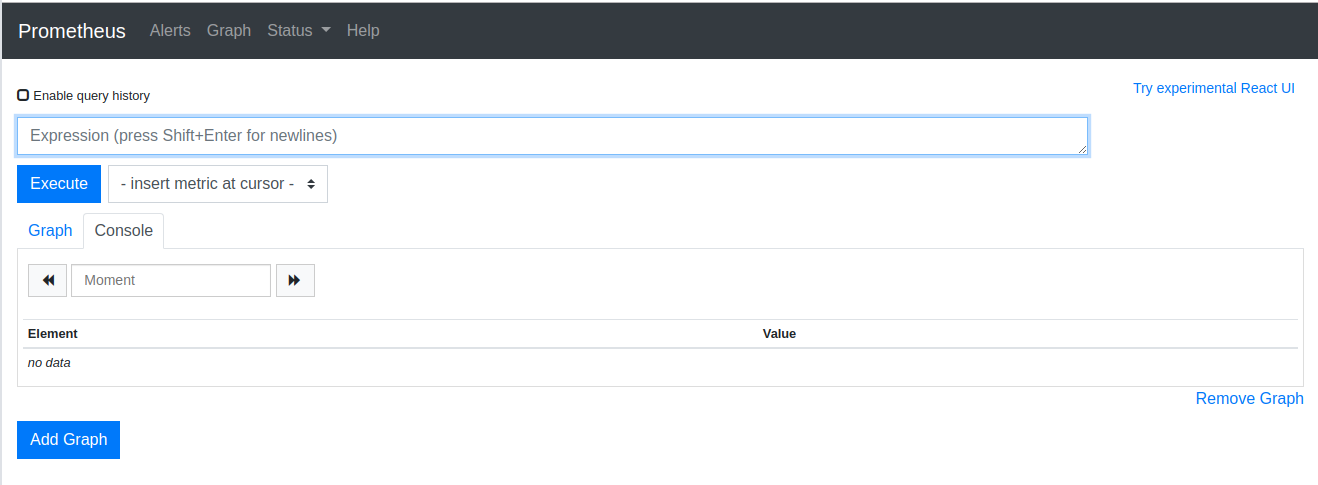
Prometheus have some basic graphing features, but you can’t use it for monitoring. To create dash board and monitor, you need to use grafana.
Node Exporter is used to collect data from servers. All monitored servers need Node Exporter installed. You can download latest version of NodeExporter from
https://github.com/prometheus/node_exporter/releases
Lets create a user for Node Exporter to run
useradd --no-create-home --system --shell /bin/false node_exporter
Install Node Exporter
cd /usr/local/src
wget https://github.com/prometheus/node_exporter/releases/download/v1.2.2/node_exporter-1.2.2.linux-amd64.tar.gz
tar xvf node_exporter-1.2.2.linux-amd64.tar.gz
cd /usr/local/src/node_exporter-1.2.2.linux-amd64/
mv node_exporter /usr/local/bin/
Create a systemd service file for node exporter
vi /etc/systemd/system/node_exporter.service
Add
[Unit]
Description=Node Exporter
Wants=network-online.target
After=network-online.target

[Service]
User=node_exporter
Group=node_exporter
Type=simple
ExecStart=/usr/local/bin/node_exporter

[Install]
WantedBy=multi-user.target
Enable and start Node Exporter
systemctl enable node_exporter
systemctl start node_exporter
systemctl status node_exporter
Node Exporter run on port 9100 and expose system metrics on url
http://SERVER_IP:9100/metrics
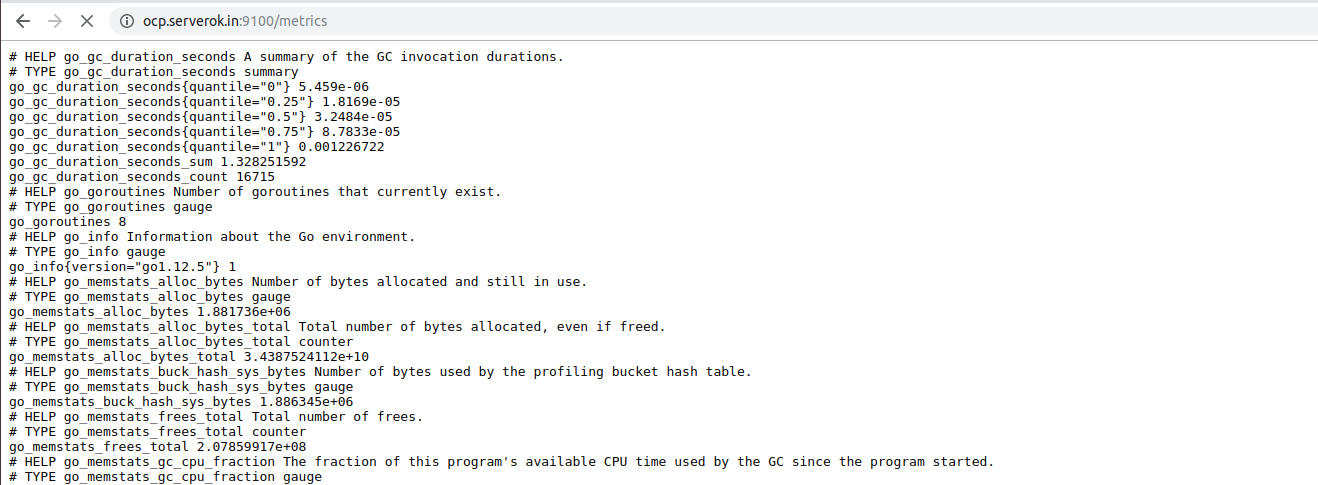
Once Node Exporter installed on a server, you need to tell Prometheus to get data from the Node Exporter you just installed. To do this, edit Prometheus configuration file.
vi /etc/prometheus/prometheus.yml
Add following
  - job_name: 'node_exporter'
    scrape_interval: 5s
    static_configs:
      - targets: ['SERVER_IP:9100']
To monitor multiple servers, you can dd more servers in targets line. Here is an example config
https://gist.github.com/serverok/83a622e7577da36384f87fe60c9930af/raw
Restart prometheus
systemctl restart prometheus
Grafana is used to visualise data collected by Prometheus. You can download Grafana from
https://grafana.com/grafana/download
Grafana offers free cloud hosted version with some limitation (1 user, 5 dashboards). Free version is suitable if you are getting started and don’t want to install your own. You can signup for cloud hosted version at
If you decide to install your own Grafana, you can run
cd /usr/local/src
wget https://dl.grafana.com/oss/release/grafana_7.3.7_amd64.deb
dpkg -i grafana_7.3.7_amd64.deb
Enable and start grafana
systemctl enable grafana-server
systemctl start grafana-server
systemctl status grafana-server
If you did your own install, grafana runs on port 3000. To access, use url
http://SERVER_IP:3000/login
Default username and passwords are “admin”. Once logged in you will be asked to set password for grafana admin user.
Before you can use Grafana, you need to set a data source and create dash board. In our case, data source is prometheus. To connect Grafana to your Prometheus insallation, go to Settings > Data Sources

On next page, select Prometheus
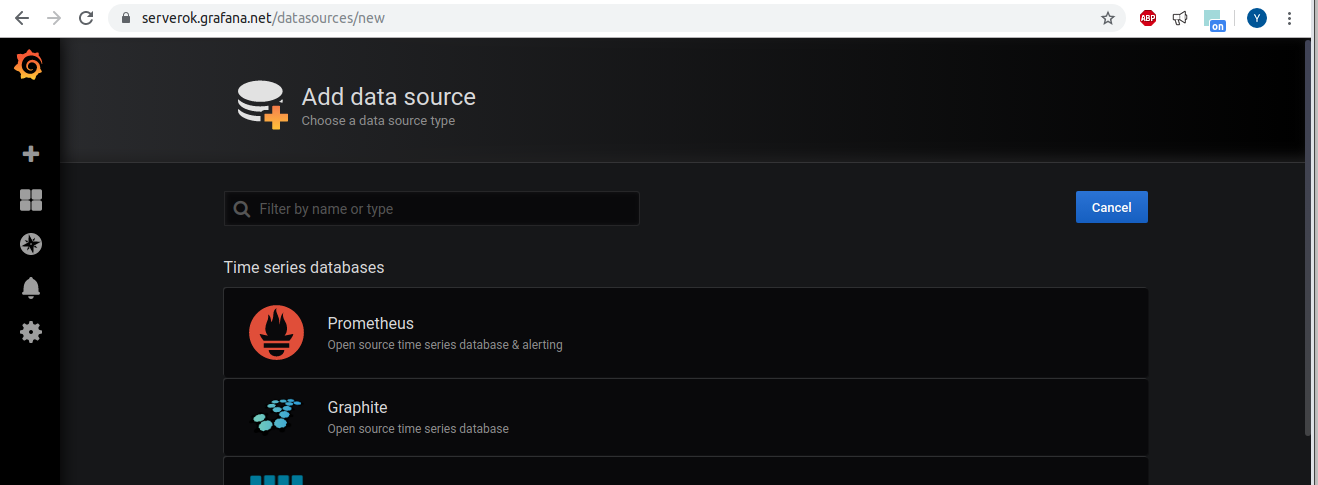
On next page, for URL, enter http://PROMETHUS_SERVER_IP:9090, scroll down, click on “Save & Test” button. If grafana can connect to your prometheus installation, you should see success message with “Data source is working”. If not, you need to check your firewall rules.
Grafana displays data in dash boards. You can create your own or use pre existing dash boards. You can find pre-made dash boards at
https://grafana.com/grafana/dashboards
On my grafana installation, i used dashboard
https://grafana.com/grafana/dashboards/11074
To add this dash board to your Grafana, click on the + button, then select Import. On next screen, you can enter ID for the dash board you need to import. In this case 11074. Click “Load” button to import the dash board.
Here is a dash board for one of the server
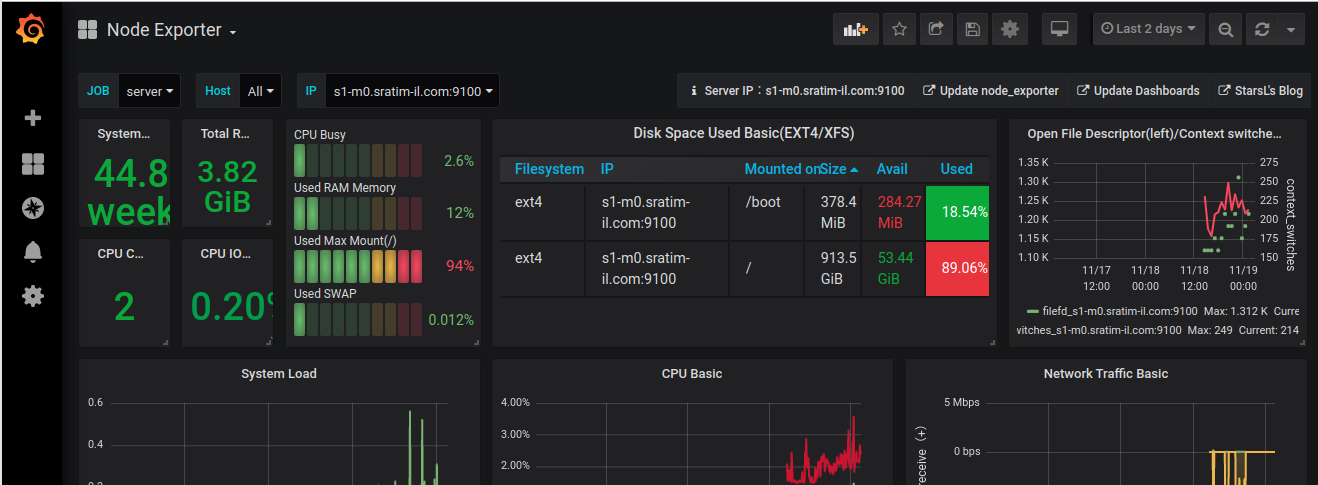
You can edit Panels in grafana dash board to see how it is created. You can create a new dash board with panel you need. This way your dashboards only show required information.
Related Posts
Prometheus Node Exporter on non default port
Prometheus init script for CentOS 6
I moved a web site to new dedicated server. But for some reason, php-fpm crashed. I increased the max_children settings, but it happend again. I do not want down time while i am investigating the problem. So i created a PHP script, that will check if site is working or not.
Script have 2 part.
health-check.php
It is simple PHP script, that get a param and print it.
This file is placed on root of your web site, so it can be accessed using URL http://yoursite/health-check.php
monitor-server.php
Create
mkdir /usr/serverok/ vi /usr/serverok/monitor-server.phpAdd following content
On the script, replace YOUR_DOMAIN_HERE with your actual domain name.
systemctl restart apache2 is for restart apache web server. If you use nginx, replace it. systemctl restart php7.2-fpm restart php-fpm, if you have differnt version of php, you need to change it.
The script is generate a random number, pass it to health-check.php script. Compared the value returned with generated random number to make sure the value is correct. If web server or php-fpm fail, this check will fail.
Now set a cronjob
crontab -eAdd
*/5 * * * * /usr/bin/php /usr/serverok/monitor-server.phpRelated Posts
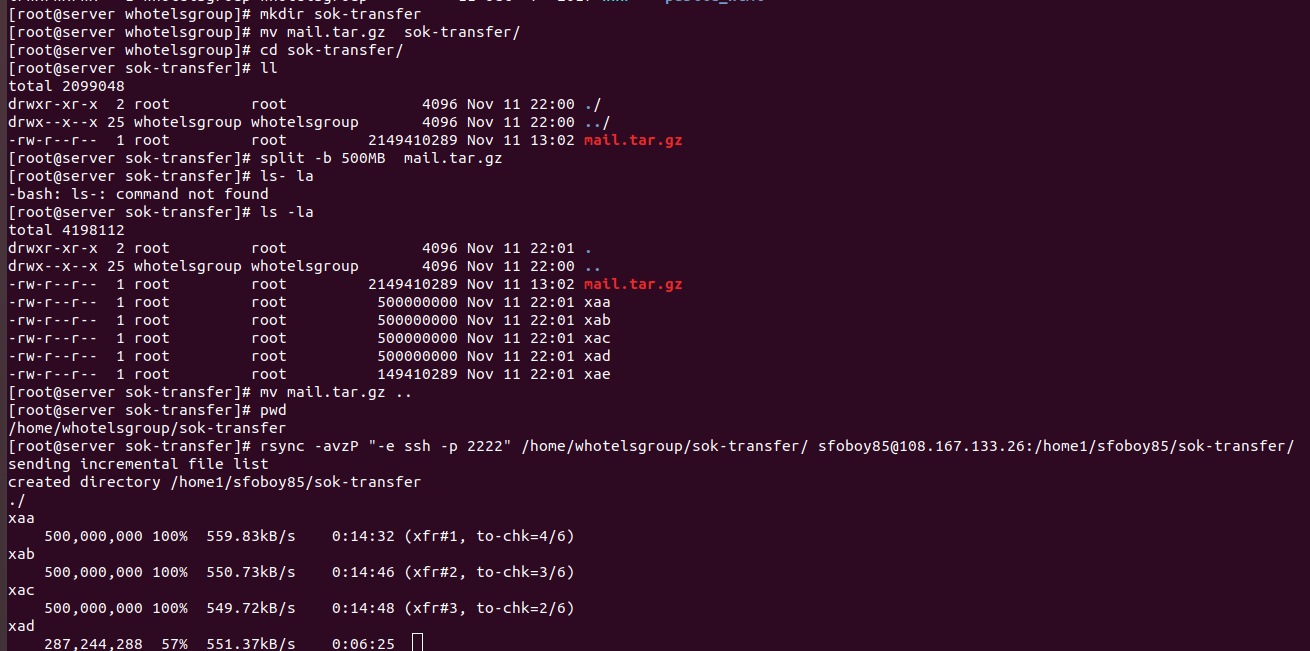
Today I was transferring a large 7 GB backup file into another server. Every time I copy it gets disconnected after some time and I have to transfer again. When transferring large files, it is better to split it into smaller files, this way if one of the file transfers failed, you only need to transfer this specific file again. With rsync, it make it easy as you can sync all files to remote server.
How to Split large CSV file into smaller files
To split a large file into smaller parts, run
split -b 500MB LARGE_FILE.tar.gz
This command will split a large file into smaller files with 500 MB size each. You can specify a different size if you need.
Once all files are on the new server, you can combine them into one file with the command
cat * > LARGE_FILE.tar.gz
When you do cat *, make sure only split files are in the current folder.
Related Posts
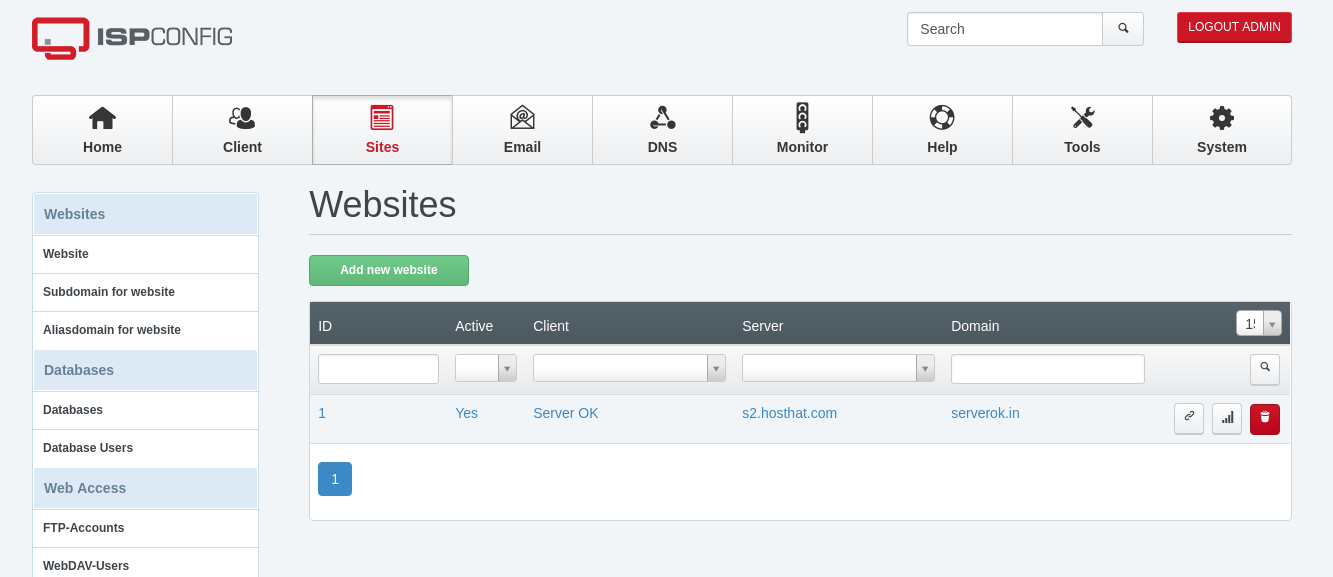
Whem creating MySQL database in ISPConfig, no database get created. To debug, i disabled the cronjob. Created a database in ISPConfig control panel, run cronjob manually, it shows following error
[root@vs-sok ~]# /usr/local/ispconfig/server/server.sh
PHP Warning:  mysqli::mysqli(): (28000/1045): Access denied for user 'root'@'localhost' (using password: YES) in /usr/local/ispconfig/server/plugins-available/mysql_clientdb_plugin.inc.php on line 528
11.11.2019-13:45 - ERROR - Unable to connect to mysqlAccess denied for user 'root'@'localhost' (using password: YES)
PHP Warning:  mysqli::mysqli(): (28000/1045): Access denied for user 'root'@'localhost' (using password: YES) in /usr/local/ispconfig/server/plugins-available/mysql_clientdb_plugin.inc.php on line 184
11.11.2019-13:45 - ERROR - Unable to connect to mysqlAccess denied for user 'root'@'localhost' (using password: YES)
finished.
[root@vs-sok ~]# /usr/local/ispconfig/server/server.sh
PHP Warning:  mysqli::mysqli(): (28000/1045): Access denied for user 'root'@'localhost' (using password: YES) in /usr/local/ispconfig/server/plugins-available/mysql_clientdb_plugin.inc.php on line 472
11.11.2019-13:46 - ERROR - Unable to connect to mysql: Access denied for user 'root'@'localhost' (using password: YES)
finished.
[root@vs-sok ~]#
This is because ISPConfig can’t connect to MySQL server for creating new MySQL database. To fix, edit file /usr/local/ispconfig/server/lib/mysql_clientdb.conf
vi /usr/local/ispconfig/server/lib/mysql_clientdb.conf
Update MySQL password for user root on this file. The content of the file look like
Related Posts

To add SSL for ISPConfig control panel, add the server hostname as a website in ISPConfig and enable the LetsEnrypt checkbox. You can find the server hostname with the command
hostname -f
That will get SSL installed for your hostname. You need to point the server hostname to the server’s IP address to get SSL certificate. Visit server hostname subdomain in a browser and verify SSL works.
Once you have a valid LetsEncrypt SSL certificate installed on your site, create a file
mkdir /usr/serverok/
vi /usr/serverok/ssl-hostname-renew
Add the following content to the file
#!/bin/bash

cat /etc/letsencrypt/live/$(hostname -f)/fullchain.pem > /usr/local/ispconfig/interface/ssl/ispserver.crt
cat /etc/letsencrypt/live/$(hostname -f)/privkey.pem > /usr/local/ispconfig/interface/ssl/ispserver.key
cat /usr/local/ispconfig/interface/ssl/ispserver.{key,crt} > /usr/local/ispconfig/interface/ssl/ispserver.pem
chmod 600 /usr/local/ispconfig/interface/ssl/ispserver.pem
systemctl restart apache2

cat /usr/local/ispconfig/interface/ssl/ispserver.crt > /etc/postfix/smtpd.cert
cat /usr/local/ispconfig/interface/ssl/ispserver.key > /etc/postfix/smtpd.key
service postfix restart
service dovecot restart

cat /usr/local/ispconfig/interface/ssl/ispserver.pem > /etc/ssl/private/pure-ftpd.pem
chmod 600 /etc/ssl/private/pure-ftpd.pem
service pure-ftpd-mysql restart
If you use nginx webserver, replace apache2 with nginx.
Make the script executable
chmod 755 /usr/serverok/ssl-hostname-renew
Run the script to activate SSL for the ISPConfig control panel, FTP, and mail server.
/usr/serverok/ssl-hostname-renew
Now set a cronjob
crontab -e
Add
@weekly /usr/serverok/ssl-hostname-renew > /dev/null
Now you should be able to access ISPConfig with a valid SSL certificate on URL
https://HOSTNAME:8080
Back to ISPconfig