Category: Linux

  • vmstat

    [root@server70 ~]# vmstat -S M 1 10
    procs -----------memory---------- ---swap-- -----io---- --system-- -----cpu-----
     r  b   swpd   free   buff  cache   si   so    bi    bo   in   cs us sy id wa st
     0  0     11    770   1009   3119    0    0    28    22   53   51  4  1 94  1  0
     3  0     11    727   1009   3120    0    0    52  2504 8387 2624 12  1 86  1  0
     0  0     11    755   1009   3120    0    0     4   157 4619 1841 12  1 86  1  0
     0  0     11    755   1009   3120    0    0   136     4 9405 1595  2  1 98  0  0
     0  0     11    755   1009   3120    0    0     0    33 4564  875  0  0 99  0  0
     1  0     11    761   1009   3120    0    0    60     0 3151 1157  2  1 97  0  0
     0  0     11    798   1009   3120    0    0    12   984 2937  898  0  0 99  0  0
     0  1     11    828   1009   3120    0    0     0   321 3108 1002  3  0 96  1  0
     0  0     11    813   1009   3120    0    0     4     0 6065 1512  6  1 93  0  0
     1  0     11    848   1009   3120    0    0     4   100 7311 1628  3  1 95  2  0
    [root@server70 ~]#
    

    vmstat 1

    * High values in “wa” column mean: IO problem
    * High values in “si”, “so” mean: excessive swapping

    Sustained high swap rates (si and so) are usually bad. The system will start spending all of its time swapping, and make no progress on any actual work. You will also see the number of runnable (r and b) processes increase. If the situation gets bad enough and free memory gets too low, the Out-of-memory (oom) logic will start killing random processes. At this point, either reducing the number of processes that normally run or adding additional RAM are about the only options.

    vmstat – Report virtual memory statistics

    vmstat [-a] [-n] [delay [ count]]
    vmstat [-f] [-s] [-m]
    vmstat [-S unit]
    vmstat [-d]
    vmstat [-p disk partition]
    vmstat [-V]
    

    vmstat reports information about processes, memory, paging, block IO, traps, and cpu activity.

    The first report produced gives averages since the last reboot. Additional reports give information on a sampling period of length delay. The process and memory reports are instantaneous in either case.

    FIELD DESCRIPTION FOR VM MODE

    
       Procs
           r: The number of processes waiting for run time.
           b: The number of processes in uninterruptible sleep.
    
       Memory
           swpd: the amount of virtual memory used.
           free: the amount of idle memory.
           buff: the amount of memory used as buffers.
           cache: the amount of memory used as cache.
           inact: the amount of inactive memory. (-a option)
           active: the amount of active memory. (-a option)
    
       Swap
           si: Amount of memory swapped in from disk (/s).
           so: Amount of memory swapped to disk (/s).
    
       IO
           bi: Blocks received from a block device (blocks/s).
           bo: Blocks sent to a block device (blocks/s).
    
       System
           in: The number of interrupts per second, including the clock.
           cs: The number of context switches per second.
    
       CPU
           These are percentages of total CPU time.
           us: Time spent running non-kernel code. (user time, including nice time)
           sy: Time spent running kernel code. (system time)
           id: Time spent idle. Prior to Linux 2.5.41, this includes IO-wait time.
           wa: Time spent waiting for IO. Prior to Linux 2.5.41, included in idle.
           st: Time stolen from a virtual machine. Prior to Linux 2.6.11, unknown.


    FIELD DESCRIPTION FOR DISK MODE

       Reads
           total: Total reads completed successfully
           merged: grouped reads (resulting in one I/O)
           sectors: Sectors read successfully
           ms: milliseconds spent reading
    
       Writes
           total: Total writes completed successfully
           merged: grouped writes (resulting in one I/O)
           sectors: Sectors written successfully
           ms: milliseconds spent writing
    
       IO
           cur: I/O in progress
           s: seconds spent for I/O


    FIELD DESCRIPTION FOR DISK PARTITION MODE

           reads: Total number of reads issued to this partition
           read sectors: Total read sectors for partition
           writes : Total number of writes issued to this partition
           requested writes: Total number of write requests made for partition
    

    FIELD DESCRIPTION FOR SLAB MODE

           cache: Cache name
           num: Number of currently active objects
           total: Total number of available objects
           size: Size of each object
           pages: Number of pages with at least one active object
           totpages: Total number of allocated pages
           pslab: Number of pages per slab
    

    Related commands

    * iostat
    * sar
    * mpstat
    * ps
    * top
    * free

    See Linux Commands

  • vgcreate

    To Create a volumegroup.

    vgcreate vg1 /dev/sdd1 /dev/sde1
    

    Example

    [root@server ~]# vgcreate vg-storage /dev/sdb
      Volume group "vg-storage" successfully created
    [root@server ~]# vgdisplay
      --- Volume group ---
      VG Name               vg-storage
      System ID             
      Format                lvm2
      Metadata Areas        1
      Metadata Sequence No  1
      VG Access             read/write
      VG Status             resizable
      MAX LV                0
      Cur LV                0
      Open LV               0
      Max PV                0
      Cur PV                1
      Act PV                1
      VG Size               9.09 TiB
      PE Size               4.00 MiB
      Total PE              2383357
      Alloc PE / Size       0 / 0   
      Free  PE / Size       2383357 / 9.09 TiB
      VG UUID               tAh3cq-EwoJ-6t94-SJtp-YoCC-XCst-4m8Ktp
       
    [root@server ~]# 
    

    See lvm

  • Disable Netdata Email Notification

    To disable email notifications from netdata, run

    /etc/netdata/edit-config health_alarm_notify.conf
    

    If the above command did not work, you can find the location of config file with the command

    find / -name "health_alarm_notify.conf"
    

    It may be in one of the following 2 locatons

    /opt/netdata/usr/lib/netdata/conf.d/health_alarm_notify.conf
    /usr/lib/netdata/conf.d/health_alarm_notify.conf
    

    You can manually edit the file

    Find

    SEND_EMAIL="YES"
    

    Replace with

    SEND_EMAIL="NO"
    

    If you edit manually, you will need to restart netdata

    systemctl restart netdata
    

    By default, it opens using nano, if you want to use vim to edit, select vim as the default editor with

    update-alternatives --config editor
    

    Or for one time

    export EDITOR=vi
    

    See netdata

  • find files by size

    On a server, i wanted to find all log files that are larger than 1 GB in size, to do this, run

    find /path/ -size +1G

    Example

    find /var/www/clients/ -name "error.log" -size +1G

    To find files older than 100 days, run

    find /var/www/clients/ -name "error.log" -mtime +100 -size +1G

    See find

  • Install drivers on Ubuntu

    Install drivers on Ubuntu

    To install drivers on Ubuntu using command line, run

    boby@sok-01:~$ sudo ubuntu-drivers devices
    == /sys/devices/pci0000:00/0000:00:01.1/0000:01:00.0 ==
    modalias : pci:v000010DEd00001F82sv00001458sd00003FCBbc03sc00i00
    vendor   : NVIDIA Corporation
    driver   : nvidia-driver-430 - distro non-free recommended
    driver   : xserver-xorg-video-nouveau - distro free builtin
    
    boby@sok-01:~$ 
    

    This list all drivers available for your hardware. You can install a driver with apt. In this cuase, i have 2 drivers available

    driver   : nvidia-driver-430 - distro non-free recommended
    driver   : xserver-xorg-video-nouveau - distro free builtin
    

    First driver is recommended by Ubuntu. To install, run

    apt install nvidia-driver-430
    

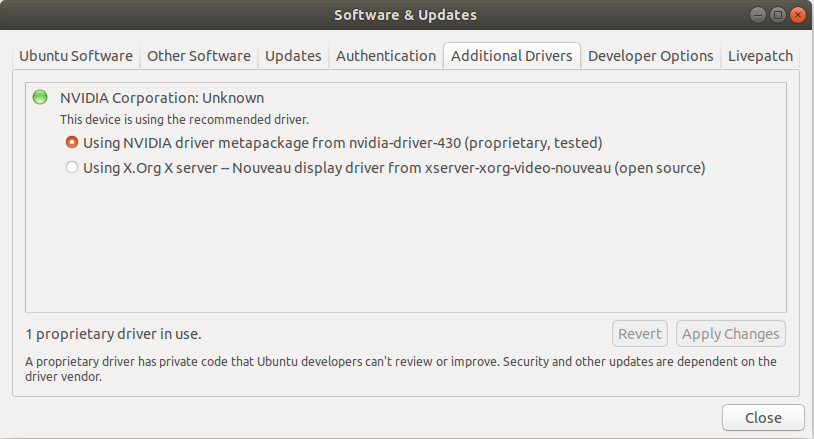
    Install Driver using Software & Updates

    Start software and updates application.

    Click on Additional Drivers tab. You will see available drivers for your computer.

  • CloudLinux CageFS

    CageFS is a virtualized file system and a set of tools that isolate each user in its own “cage”. It is developed by CloudLinux OS, which is a Linux-based operating system designed for web hosting servers.

    CageFS prevents users from seeing each other and accessing sensitive information, such as system files, tools, etc. It also protects the server from various attacks, such as privilege escalation and information disclosure.

    CageFS is transparent to the users and does not require any changes to their scripts or applications. It works with various web hosting control panels, such as cPanel, Plesk, DirectAdmin, etc.

    CageFS Installation

    mkdir /home/cagefs-skeleton
    ln -s /home/cagefs-skeleton /usr/share/cagefs-skeleton
    yum install cagefs
    /usr/sbin/cagefsctl --init

    Go to

    cPanel WHM WHM -> Server Configuration -> Basic cPanel/WHM Setup -> Basic Config -> Additional home directories

    Change the value to blank (not default “home”). Without changing this option, cPanel will create new accounts in incorrect places.

    On saving, you get

    Modifying “Home Directory Prefix” from “home” to “”.

    Enable CageFS

    /usr/sbin/cagefsctl --enable-all

    Manage CageFS

    /usr/sbin/cagefsctl --list-enabled
    /usr/sbin/cagefsctl --list-disabled
    /usr/sbin/cagefsctl --display-user-mode

    Updating Software

    After php.ini or software change, run

    cagefsctl --update

    Or if you have recently updated, run

    cagefsctl --force-update

    Allow Software in CageFS

    To allow ffmpeg, mplayer, etc.. create file

    vi /etc/cagefs/conf.d/vshare.cfg

    Add

    [vshare]
    comment=vShare Youtube Clone Requirements
    paths=/usr/bin/ffmpeg, /usr/bin/mencoder, /usr/bin/mplayer, /usr/bin/flvtool2, /usr/bin/lame, /usr/bin/yamdi, /usr/bin/qt-faststart
    
    vi /etc/cagefs/conf.d/git.cfg
    

    Add

    [git] 
    comment=Git tools 
    paths=/usr/bin/git,/usr/share/git-core,/usr/bin/git-receive-pack,/usr/bin/git-upload-pack,/usr/bin/git-pull,/usr/bin/git,/usr/bin/git-cvsserver,/usr/bin/git-upload-archive,/usr/bin/gitk,/usr/bin/git-shell, /usr/libexec/git-core/
    

    See cloudlinux

  • blkid

    To list UUID for all your storage devices, run ”’blkid -c /dev/null”’

    blkid - locate/print block device attributes
    

    Example

    boby@bizhat ~ $ sudo blkid -c /dev/null
    [sudo] password for boby: 
    /dev/sda1: UUID="c17be3a7-dd65-448a-8930-b9d0369c6575" TYPE="ext4" 
    /dev/sda2: UUID="c72e257f-b210-4f81-b1de-e5130d61454e" TYPE="ext4" 
    /dev/sda3: UUID="ab289ee4-fa14-4da0-af60-a9c4360327b2" TYPE="swap" 
    /dev/sda5: UUID="b1ebdc91-64a8-46b0-a9ee-8e71c659bba0" TYPE="ext4" 
    /dev/sda8: LABEL="Drive J" UUID="01CE4B5BC914BE10" TYPE="ntfs" 
    /dev/sdb1: UUID="67fd4ee7-1123-433c-aab4-ed877051976d" TYPE="ext4" 
    /dev/sdb5: UUID="28f4e904-ecfa-4a9f-b632-60c58c826cfc" TYPE="swap" 
    /dev/sdb6: UUID="19ca47a8-d894-44ff-a7af-77fa16635e98" TYPE="ext4" 
    /dev/sdc1: LABEL="Drive E" UUID="709409F99409C298" TYPE="ntfs" 
    /dev/sdc2: LABEL="Drive C" UUID="BC108B2C108AECA8" TYPE="ntfs" 
    /dev/sdc5: LABEL="Drive D" UUID="2ED4A94DD4A917DB" TYPE="ntfs" 
    /dev/sdc6: LABEL="New Volume" UUID="FEA6945FA69419EB" TYPE="ntfs" 
    /dev/sdc7: LABEL="Drive G" UUID="A4A08A44A08A1CC4" TYPE="ntfs" 
    /dev/sr1: LABEL="Idea Net Setter" TYPE="iso9660" 
    boby@bizhat ~ $ 
    

    To mount /dev/sda5, i added following to /etc/fstab

    UUID=b1ebdc91-64a8-46b0-a9ee-8e71c659bba0 /home/boby/store ext4  defaults  0 2
    

    It is same as

    /dev/sda5 /home/boby/store ext4  defaults  0 2
    

    Linux Commands > hdd

  • atop

    The program atop is an interactive monitor to view the load on a Linux system.

    To install on Ubuntu/Debian

    apt-get install atop

    On CentOS/RHEL

    yum install atop

    On CentOS, you will need epel repo enabled.

    View Historical Data

    One of the powerful features of atop is its ability to record and store detailed snapshots of system performance, allowing you to go back and review exactly how resources were used at any given time. This is invaluable for diagnosing past performance issues, investigating system load patterns, and understanding resource usage over time. With atop’s logging capabilities, you can access historical data quickly and analyze it interactively, just as if you were viewing real-time activity.

    Atop stores its log files by default in the /var/log/atop/ directory, with filenames that include the date (formatted as atop_YYYYMMDD), making it easy to locate and access historical performance data for specific days.

    To view past data with atop, use the replay mode by running the following command:

    atop -r

    This will open today’s log file in replay mode. If you need older logs, you can specify the log file with -r option.

    atop -r /var/log/atop/atop_YYYYMMDD

    Replace YYYYMMDD with the desired date to load the log file for that day.

    Once in replay mode, you can navigate through the data using keyboard shortcuts t and T to jump forward or backward in 10-minute intervals, and b or e to jump to the beginning or end of the log. This lets you explore historical resource usage interactively, just as you would with real-time data.

    Back to Linux Commands

  • Using apt-get to manage software

    apt-get used to manage packages in Debian/Ubuntu server.

    Install A Package

    apt-get install PKG_NAME
    

    Uninstall a software (keep configuration file)

    apt-get remove PKG_NAME
    

    Uninstall a software and its configuration files

    apt-get --purge remove PKG_NAME
    

    To upgrade a software

    apt-get upgrade PKG_NAME
    

    Update Package Info

    apt-get update
    

    Remove Unwanted Programs

    apt-get autoremove
    

    Back to apt

  • install ShadowSocks client in Ubuntu 18.04

    install ShadowSocks client in Ubuntu 18.04

    ShadowSocks client is part of shadowsocks package. This include both client and server. If you are looking to install server, see Install ShadowSocks server on Debian 10

    To install ShadowSocks, run

    apt install -y shadowsocks
    

    ShadowSocks client is called sslocal, get installed in /usr/bin/sslocal.

    On Ubuntu, no start up script provided with this package, so you need to create one or manually run sslocal when required.

    Create a service file

    vi /lib/systemd/system/[email protected]
    

    Add following content

    [Unit]
    Description=Shadowsocks client mode service
    Documentation=man:sslocal(1)
    After=network-online.target
    
    [Service]
    Type=simple
    User=nobody
    Group=nogroup
    ExecStart=/usr/bin/sslocal -q -c /etc/shadowsocks/%i.json
    Restart=on-failure
    RestartSec=30
    
    [Install]
    WantedBy=multi-user.target
    

    Now we need to create a configuration file with your ShadowSocks server IP and password.

    mkdir /etc/shadowsocks/
    vi /etc/shadowsocks/local.json
    

    Add following content

    {
        "server":"YOUR_SERVER_IP",
        "server_port":8044,
        "local_address": "127.0.0.1",
        "local_port":8044,
        "password":"PASSWORD",
        "timeout":300,
        "method":"aes-256-cfb",
        "fast_open": false,
        "workers": 1,
        "prefer_ipv6": false
    }
    

    “server” = IP of the server where you installled ShadowSocks server.
    “server_port” = Port used by ShadowSocks server
    “password” = ShadowSocks server password.

    local_port can be anything you like.

    Enable shadowsocks service

    systemctl enable shadowsocks-local@local
    

    To start

    systemctl start shadowsocks-local@local
    

    To see status

    systemctl status shadowsocks-local@local
    

    Now you can configure your browser or other sock proxy supported application using 127.0.0.1:8044. Here is how to configure firefox

    shadowsocks firefox settings